
In my work as an information professional, I’ve seen some very funky cold bullshit in the form of graphs and charts.
Let’s chat a bit, you and me, about what bad graphs do, why, and how to avoid bamboozlement at the hand of someone who calls themselves a “graphologist,” not realizing that “graphologist” is the term for someone who studies handwriting in order to get a glimpse into someone’s psyche, which is basically a half-step above someone who reads tea leaves. Read THIS, you goddamn hippie:
Tipping the Scales

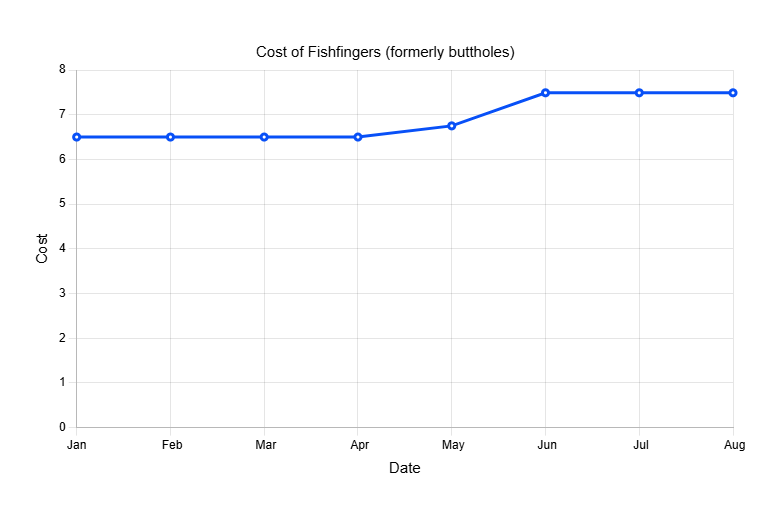
If you saw this, your first thought would probably be, “FishFINGERS? The fuck? Fish don’t have fingers…do they?”
I just googled “Do ANY fish have fingers?” and this was a top image result:

I…can’t possibly imagine how this works, and I’m sure that if I read the article, it’d be logical, sensible, and boring AF, so let’s instead assume that humans developed fingers so they could point at fish buttholes and laugh.
Anyway, your initial reaction to the above graph was probably, “Wow, fishfingers have about tripled in cost! That’s nuts!”
But if fishfingers had tripled in price, they would cost about $20 bucks, not $7.50. Yes, I know I used the dollar sign and not pounds. This is an AMERICAN newsletter. Are you trying to get me tariffed, here?
Here’s what the graph should look like:
How did they manage this trickery? It’s a simple matter of NOT starting your Y (or vertical) axis with 0. Here, I can re-create the effect like so:
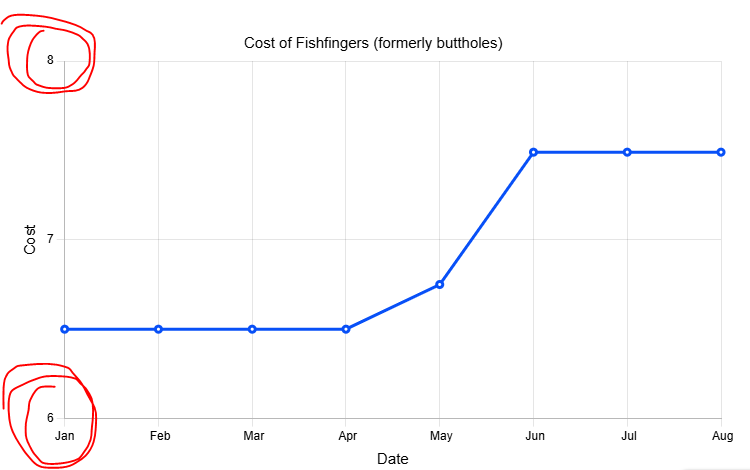
When your bottom value is 6 and your top value is 8, well, that makes for a far more dramatic flourish, doesn’t it?
Here’s another one that did something similar, but with the opposite intent and using trickery on BOTH axes:
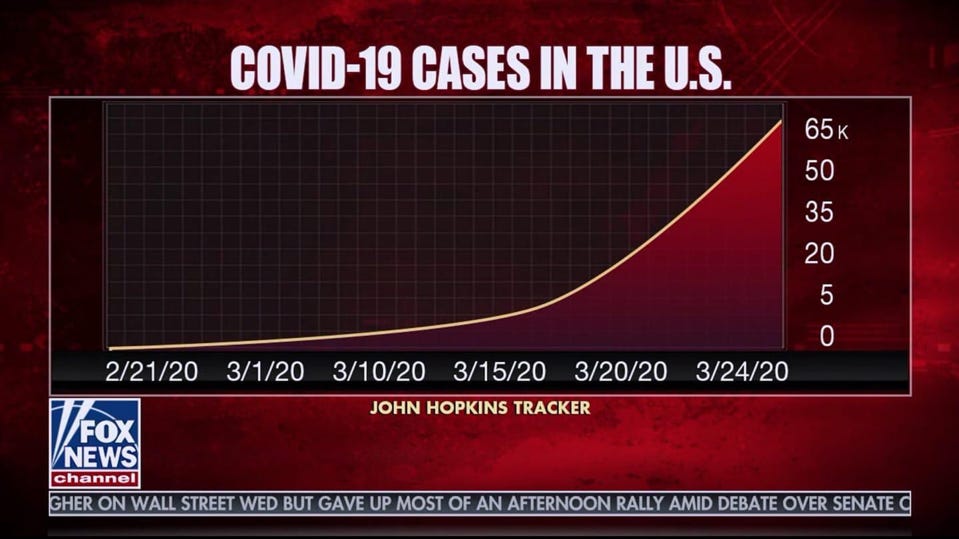
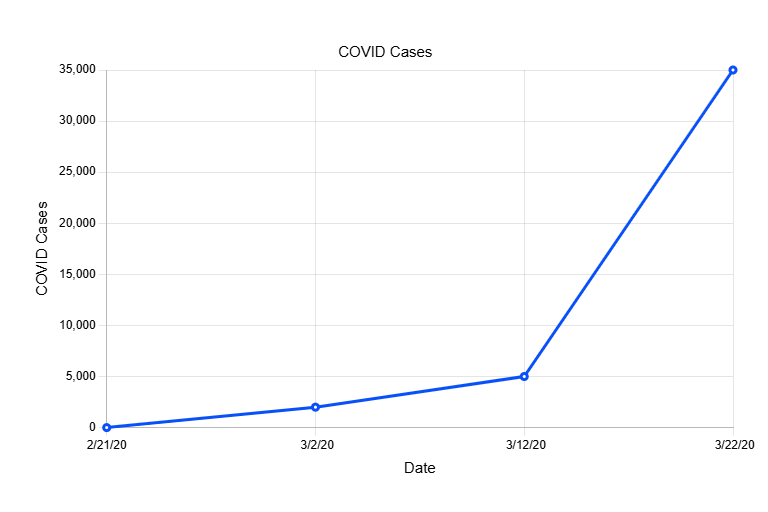
This one is from Fox News during 2020. C’mon, it can’t all be fish buttholes and good times.
I can only assume this graph was either made by a dummy or that it was meant to minimize the rise in COVID cases by making the X and Y axes have different value jumps for the same amount of space. The “Dummy” answer has some weight to it, though, because it’s “JohnS Hopkins,” not John Hopkins, assholes, unless John Hopkins is just some dude who was tracking COVID cases on his own at the time.
If you look on the X (horizontal), you’ll see we have evenly-spaced dates, but the number of days between them are 9, 9, 5, 5, and 4 respectively, meaning the amount of time between dates is decreasing, but this decrease is not represented spatially in the chart and instead the space between a 9-day interval and a 4 day interval are the same.
On the Y (vertical), you’ll see the space from 0 to 5 and all the others, which go up by 15, are represented with the same amount of space.
Here, let me fix it for you all so that both axes are consistent:
Another?
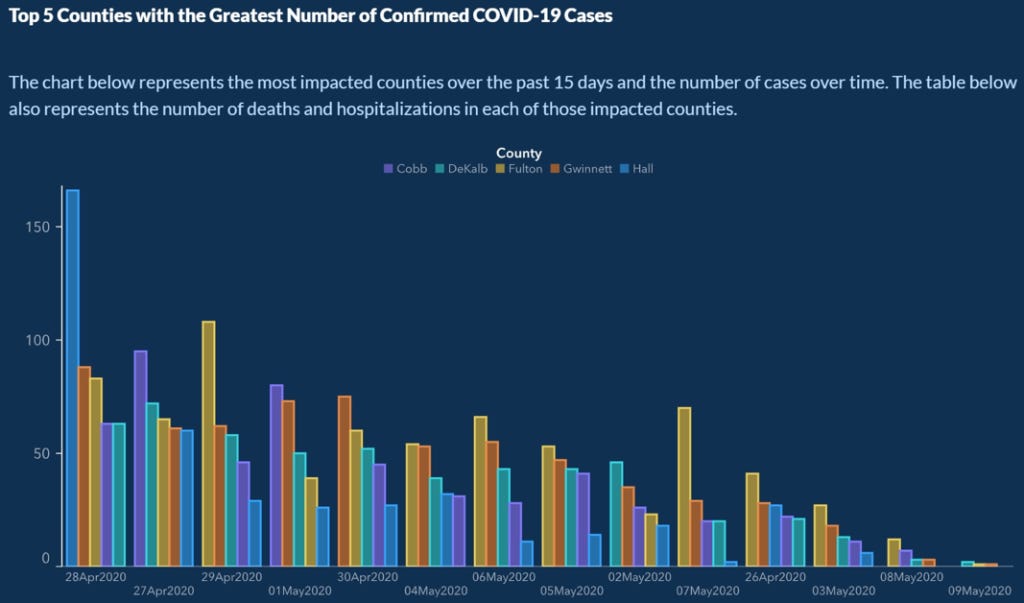
Here we have a chart, put out by The Georgia Department of Public Health sometime in 2020, which seems to show, whew, we got through that one!
Until you realize that the dates along the X-axis (horizontal) are not chronological.
Let me fix that up for you:
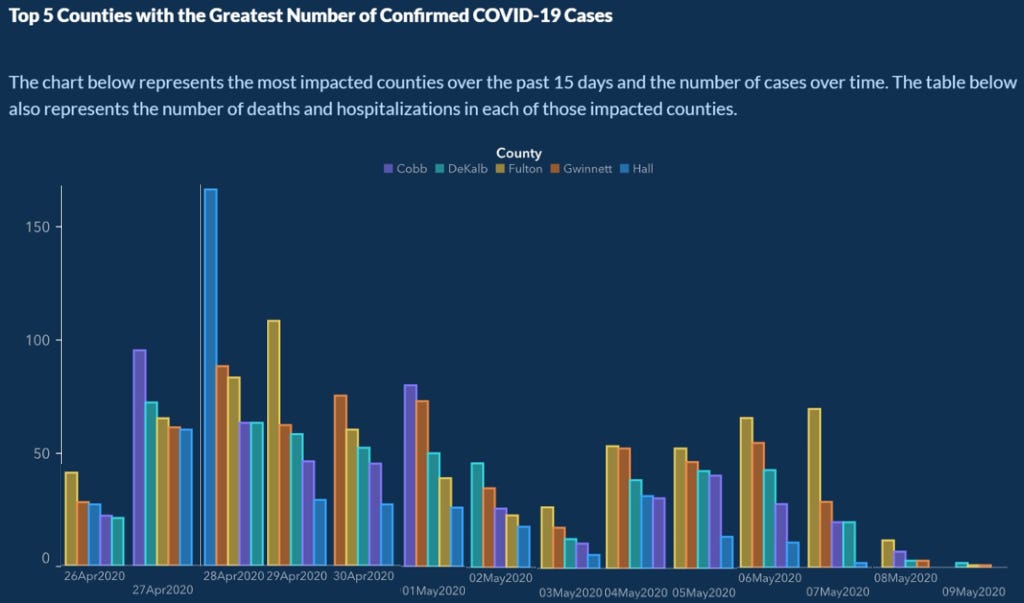
It’s a different picture, right? One that tells us what we all kinda figured out during the early days of pandemic: this whole thing isn’t happening in a super predictable way, more like waves than a linear decrease.
In all three cases here, we have two charts, same information, very different stories, eh?
Sometimes You Just Don’t Need a Chart

These sorts of things are usually made by someone who just didn’t know what the fuck they were doing. Someone probably said, “Make this into an infographic or something, a wordle or whatever so it’s fun,” and someone was like, “Uh…yes, I can do that…”
Then they created this monstrosity, which is not in any logical order and also seems to imply there’s a 100% at play here, seeing as there is a 100% of an outline of a person, but this person is filled with 243% total, sort of like me whenever I find a place that serves a creamy, salty mac and cheese dish that I can pretend is fancy and bespoke or whatever, and really it’s just goddamn mac and cheese that’s okay to eat as an adult because it costs $24 dollars and was served to you by someone who looks sort of like they work in a restaurant and sort of like they’re dressed to work in a machine shop.
I don’t know that this is data that really cries out for visualization so much as interpretation. Possible takeaways: Boomers are not tech-savvy, but they are willing to learn. They like working with people and feel that’s where their skills lie. They are potentially more creative than you think and likely even value their creative skills over their leadership skills.
Here’s another:
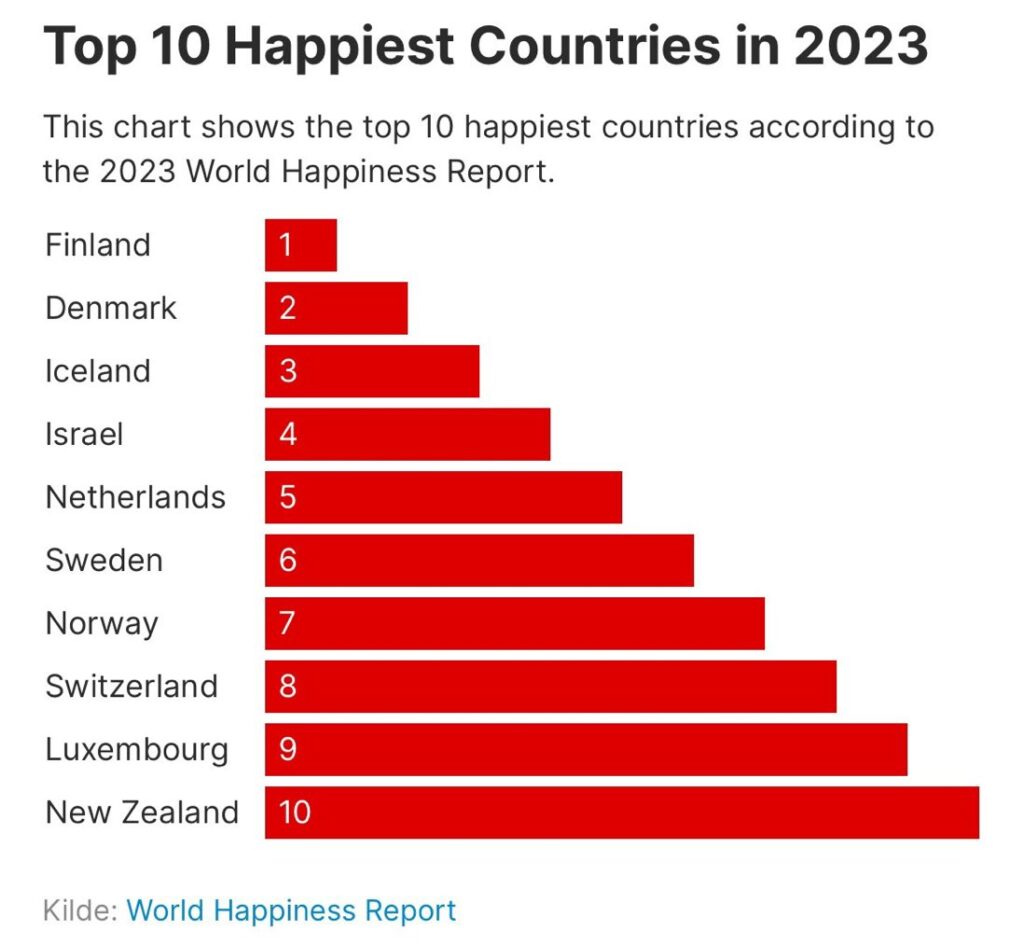
Yeah, I mean…the NUMBER 1 is a tenth of 10, but rankings don’t really work that way, right? Like, I don’t think Finland is 10x happier than New Zealand.
Which I just confirmed here, on the 10-point happiness scale, however the fuck that works, Finland was a 7.804 and New Zealand was a 7.123, a VERY small difference.
Also, this is goddamn backwards. If New Zealand has the least happiness of the 10 countries charted, why is its bar the largest?
These visualizations, like most of my book reviews, are not necessary or helpful.
Tips for Looking at Stuff
I have some tips for you as a consumer of information. Because you don’t need to know a ton to know when you’re being manipulated.
If the chart doesn’t start at zero, there might be something fish(finger)y. This isn’t ALWAYS the case, there are a few situations where starting from zero might not make sense. If we were examining the different heights at which commercial airliners fly, and if the point isn’t to try and demonstrate that Hooters Air was flying INSANELY high or whatever, if the degree of difference isn’t important, then it might be okay to start a bit higher than 0. But that’s a RARE case, okay? As rare as a commercial airliner being based around a breastaurant.
Axes should be labeled, and the distances between two things should always represent the same amount of stuff. I know, that’s vague, just remember the examples above: If the horizontal axis shows dates, each of those dates should be separated by the same amount of time. If an axis shows dollar amounts, the increase in dollar amounts should be the same over a given amount of space.
Ask yourself whether the chart makes things clearer or less clear. In the example above, the Boomer chart, I think it takes more energy to interpret the graphic’s meaning than it does to interpret the plain text results.
Also in the Boomer chart, remember that just because something is in a chart format, that doesn’t make it “hard data.” Self-reported survey responses, put into a chart, are still very much opinion, not fact.
If it seems like the chart is saying something that could be quantified as a “bombshell,” then it’s a good idea to examine it closely. The more exciting or engaging the information is, the higher your level of scrutiny should be.
If a chart doesn’t make it very easy to trace back the original information source, you shouldn’t necessarily trust it.
Never, ever, ever, ever, ever share a chart online without looking into it first. You need to check that the chart is accurate, and you need to check that it’s using good data. Sharing a bad chart is, in my humble opinion, equivalent to making one. Take ownership over what you put into the world.
What is this graph trying to get me to FEEL?
Graphs and charts are great tools for presenting information in ways that help you feel ways about stuff.

This can be a good thing. It can be hard to take very large numbers and really understand what they mean. It can be hard to see an overall trend that’s decidedly headed in one direction or another when you just look at a bunch of numbers.
And it can also be a bad thing because charts can be manipulated to make your feelings about something override your brain.
So, if nothing else, if all this axis bullshit and data manipulation is just too much work, fall back to asking yourself ONE question when you see a graphic representation of data: Is this designed to flesh out information in a way that’s easier to comprehend, or is it designed to make me FEEL a certain way?
https://www.reddit.com/r/interestingasfuck/comments/ywp612/world_population_over_the_last_12000_years/